Analysis tab
This tab is dedicated to the visualization and analysis of grouped data. The data used in this tab consist of the .mat files generated by the Analysis functions of umIT.
Sections
Tab components
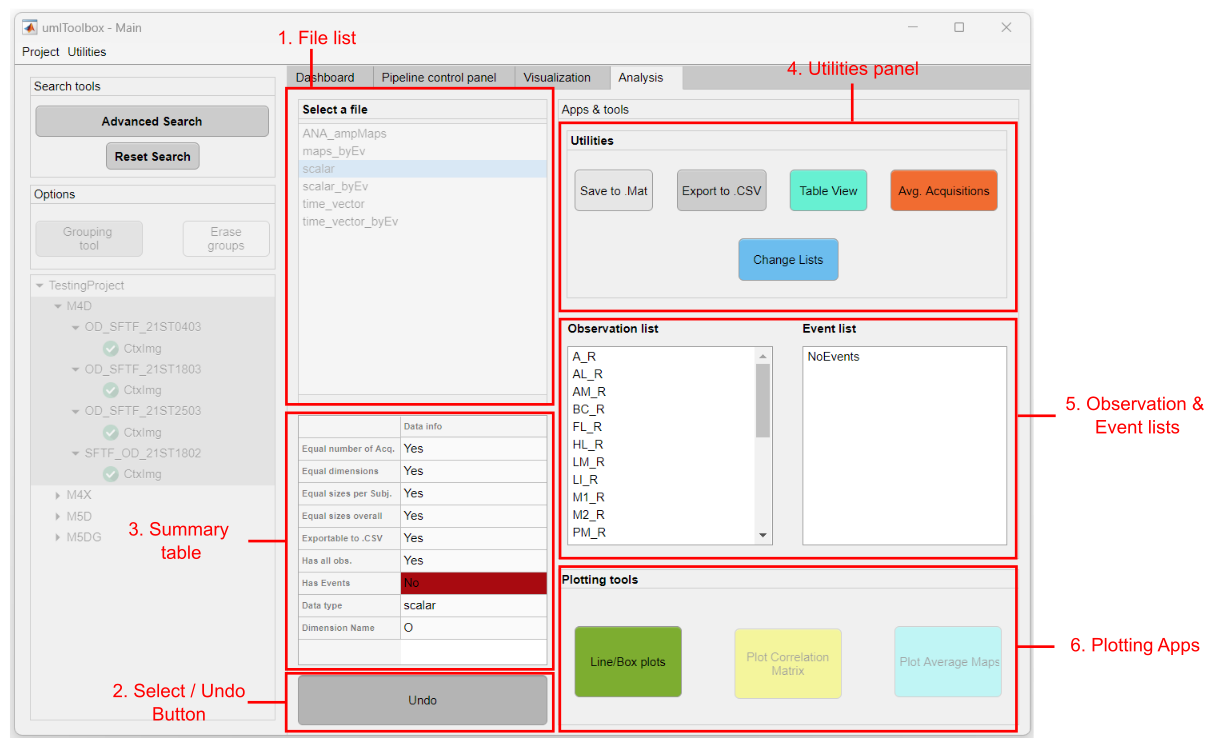
Main components of the Analysis tab.
1. File list
List of .mat files located in the folders of the selected objects.
2. Select/Undo button
Click on "Select" to load the data from the selected file from the File list and access the Apps & Tools panel. To Select a new set of data, click on "Undo" and start over.
3. Summary table
This table gives an overview of some features of the selected data. For instance, it shows if the selected data has equal dimensions, if it is exportable to .CSV and it's data type and dimension names. These features will determine the availability of some tools from the Apps & Tools panel.
Note
This table is updated only when the Select button is pressed. Thus, it describes the "original" data. This means that the table is not updated after changes on the data using the utilities tools (e.g. Avg Acquisitions or Change Lists).
4. Utilities panel
In this panel, there are options to export the data outside umIT as well as to merge acquisitions and create subsets of observations and/or events. Here is the list of available options (click on the links for further details):
- Save to .MAT: exports the data to a .mat file to be used outside umIT. The file contains a stucture called stats_data with all observation data and metadata
- Export to .CSV: exports the data to a .CSV file to be accessed outside MATLAB (1 or 2D data only!)
- Table View: visualizes the data as a table (1 or 2D data only!)
- Average Acquisitions: averages consecutive acquisitions
- Change Lists: reorder and subset the observation and/or event lists
5. Observation & Event lists
Here, the list of unique values of observations and/or events are shown. The elements in these lists will be those to be used by the utilities and plotting apps. To rearrange and/or subset these lists, use the Change lists tool.
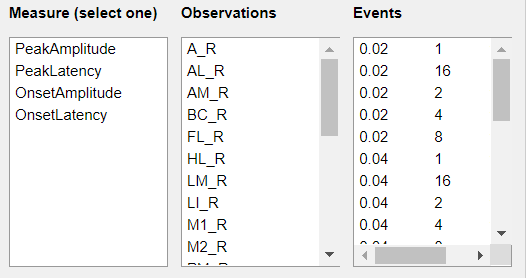
Note
Some analysis functions generate multiple measures. In this case, a extra list will appear to select which measure to use in the plotting tools (*exporting tools and table view will show all measures!):
6. Plotting apps
This panel contains the plotting apps currently available. These tools allows one to exploredifferent types of data and compare between experimental groups.
- Line/Box plot: plots scalar or time series data
- Plot Correlation Matrix: plots correlation matrices
- Plot Average Maps: plots average activation maps per experimental groups
Options panel
The panel contains options to create and manage groups.
1. Grouping tool
This button launches the Data grouping tool. This tool allows the segregation of the elements from the object tree into two or more groups.
Click here for more info about how to use the Data grouping tool!
2. Erase groups
Click here, to erase the groups created using the Data grouping tool and restore the object tree to the original list.
How to select data for analysis
In order to have access to the Apps & Tools panel, one has to:
- select the data from the object tree (left)
- select the filename from the Select a file list
- Click on the Select button
Note
Once the file is selected in the Select a file list, a green check icon will appear on the items from the object tree containing the selected file. Review the object tree to be sure of which objects are selected before clicking on the Select button on the bottom of the Analysis tab.
Example of data selection for analysis. Note that the items from the object tree containing the selected files are highlighted with a green check icon.