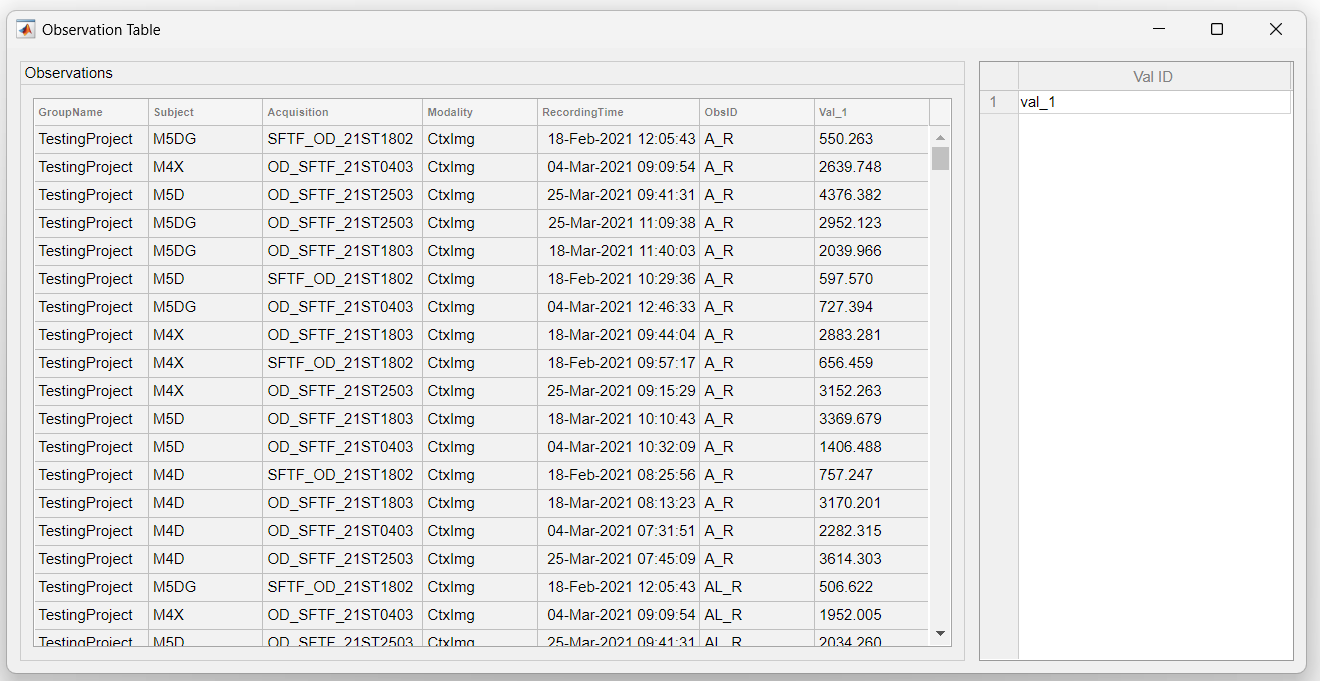
Table View
The data that is visible as a table should be either scalar (i.e. single value) or a vector (i.e. array with 1 x N values). The table has the following columns. The Labels of the data (i.e. Val_(1-N)) are shown in a second table on the right:
| Column name | Description |
|---|---|
| GroupName | The name of the experimental group |
| Subject | The name of the subject |
| Acquisition | The name of the acquisition/recording |
| Modality | The name of the recording modality |
| RecordingTime | Timestamp of the recording (start) with format DD-MMM-YYYY HH:mm:ss |
| ObsID | The name of the observation (e.g. ROI) |
| val_(1 - N) | One or more columns with data. The column name corresponds to the label of each data point. The labels are generated by one of the Analysis functions |
