Setting up cameras and filters spectra
Some analysis functions (e.g., run_HemoCompute) in the toolbox need to use the optical parameters from the acquisition system, such as the spectral profiles of filters, illumination sources, and cameras. This information is stored in .mat files inside the folder .../Umit/IOIAnalysis/SystemOpticalParams and can be updated as needed.
The list of filter spectra as well as camera and filter set profiles can be modified using the GUI in DataViewer (Utilities >> System Optical Parameters):
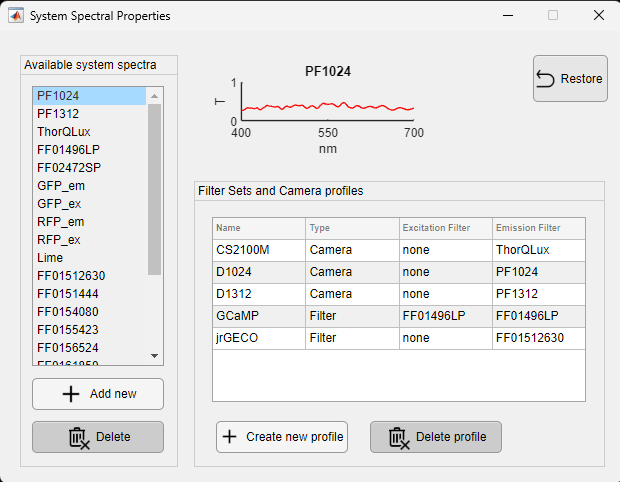
Here is a description of the elements of the interface:
Available System Spectra
The left‐hand “Available System Spectra” list lets you view and manage every stored spectral curve.
- Import New Spectrum
Click Add and select a .txt file (two columns: wavelength [nm], transmittance [0–1]). You can download these exports from vendor sites such as SearchLight. - Preview Spectrum
Select any entry to display its static transmittance curve in the graph area. - Delete Spectrum
Highlight an entry, click Delete, and confirm. Built-in spectra are greyed out and protected.
Filter Sets & Camera Profiles
The bottom‐center table defines imaging channels by pairing excitation and emission spectra.
| Name | Type | Excitation Filter | Emission Filter |
|---|---|---|---|
| CS2100M | Camera | none | ThorQLux |
| D1024 | Camera | none | PF1024 |
| GCaMP | Filter | FF01496LP | FF01496LP |
- Create New Profile
Click New Profile, select Type (Camera or Filter Set), enter the new profile name and select the excitation/emission spectra from the dropdowns, then click Finish. - Delete Profile
Select a row, click Delete, and confirm.
Restoring Defaults
Click the Restore button (top-right) to revert all unsaved edits back to the last saved state.
Saving & Applying Changes
Once you’ve finalized your edits, just close the GUI and the changes will be saved. All modifications are stored in the .mat configuration files—see the Details about the .mat files section for format and path.
Details about the .mat files
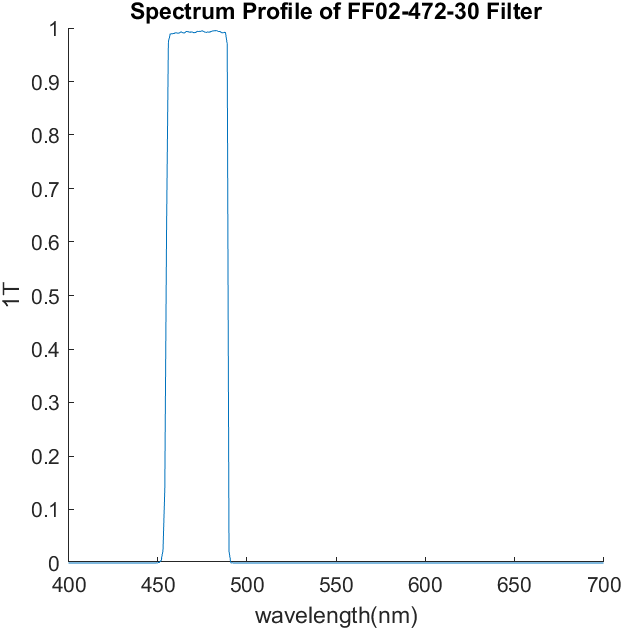
SysSpect.mat
Contains a list of all available spectral profiles from filters and cameras. The spectrum of each item consists of a vector with a length of 301 samples. The data is normalized from 0 to 1, and the wavelength ranges from 400 to 700 nm. Here is an example of the spectral profile of a band-pass filter at 472 nm (FF0247230):
FilterSets.mat
This file contains a list of filter combinations (or sets) used. Each variable is a Matlab structure that contains the fields Excitation and Emission. The value of each field is the name of the spectral profile stored in the SysSpect.mat file.
CameraSpect.mat
This file contains a list of camera models and their corresponding spectral profiles in the SysSpect.mat file. The default cameras are the following: