DataViewer
DataViewer is a graphical interface to visualize functional imaging recordings. The app provides basic tools to explore distinct types of recordings such as image time series, event-triggered time series and correlation maps. DataViewer can be called from the visualization tab of the umIToolbox app or as standalone. The app opens the following data (dimension names):
- Image time series (Y,X,T)
- Event-triggered image time series (E,Y,X,T)
- Single frames (Y,X)
- Seed-pixel correlation maps (Y,X,S)
Syntax
DataViewer(): Opens the main GUI.
DataViewer('C:/PATH/datFile.dat'): Opens the app with the imaging data from datFile.dat. The .dat file created by one of the analysis functions of umIT.
The interface
The main components of the graphical interface are: a main window, containing file and data control options, an image window and a temporal signal window (if the time dimension exists).
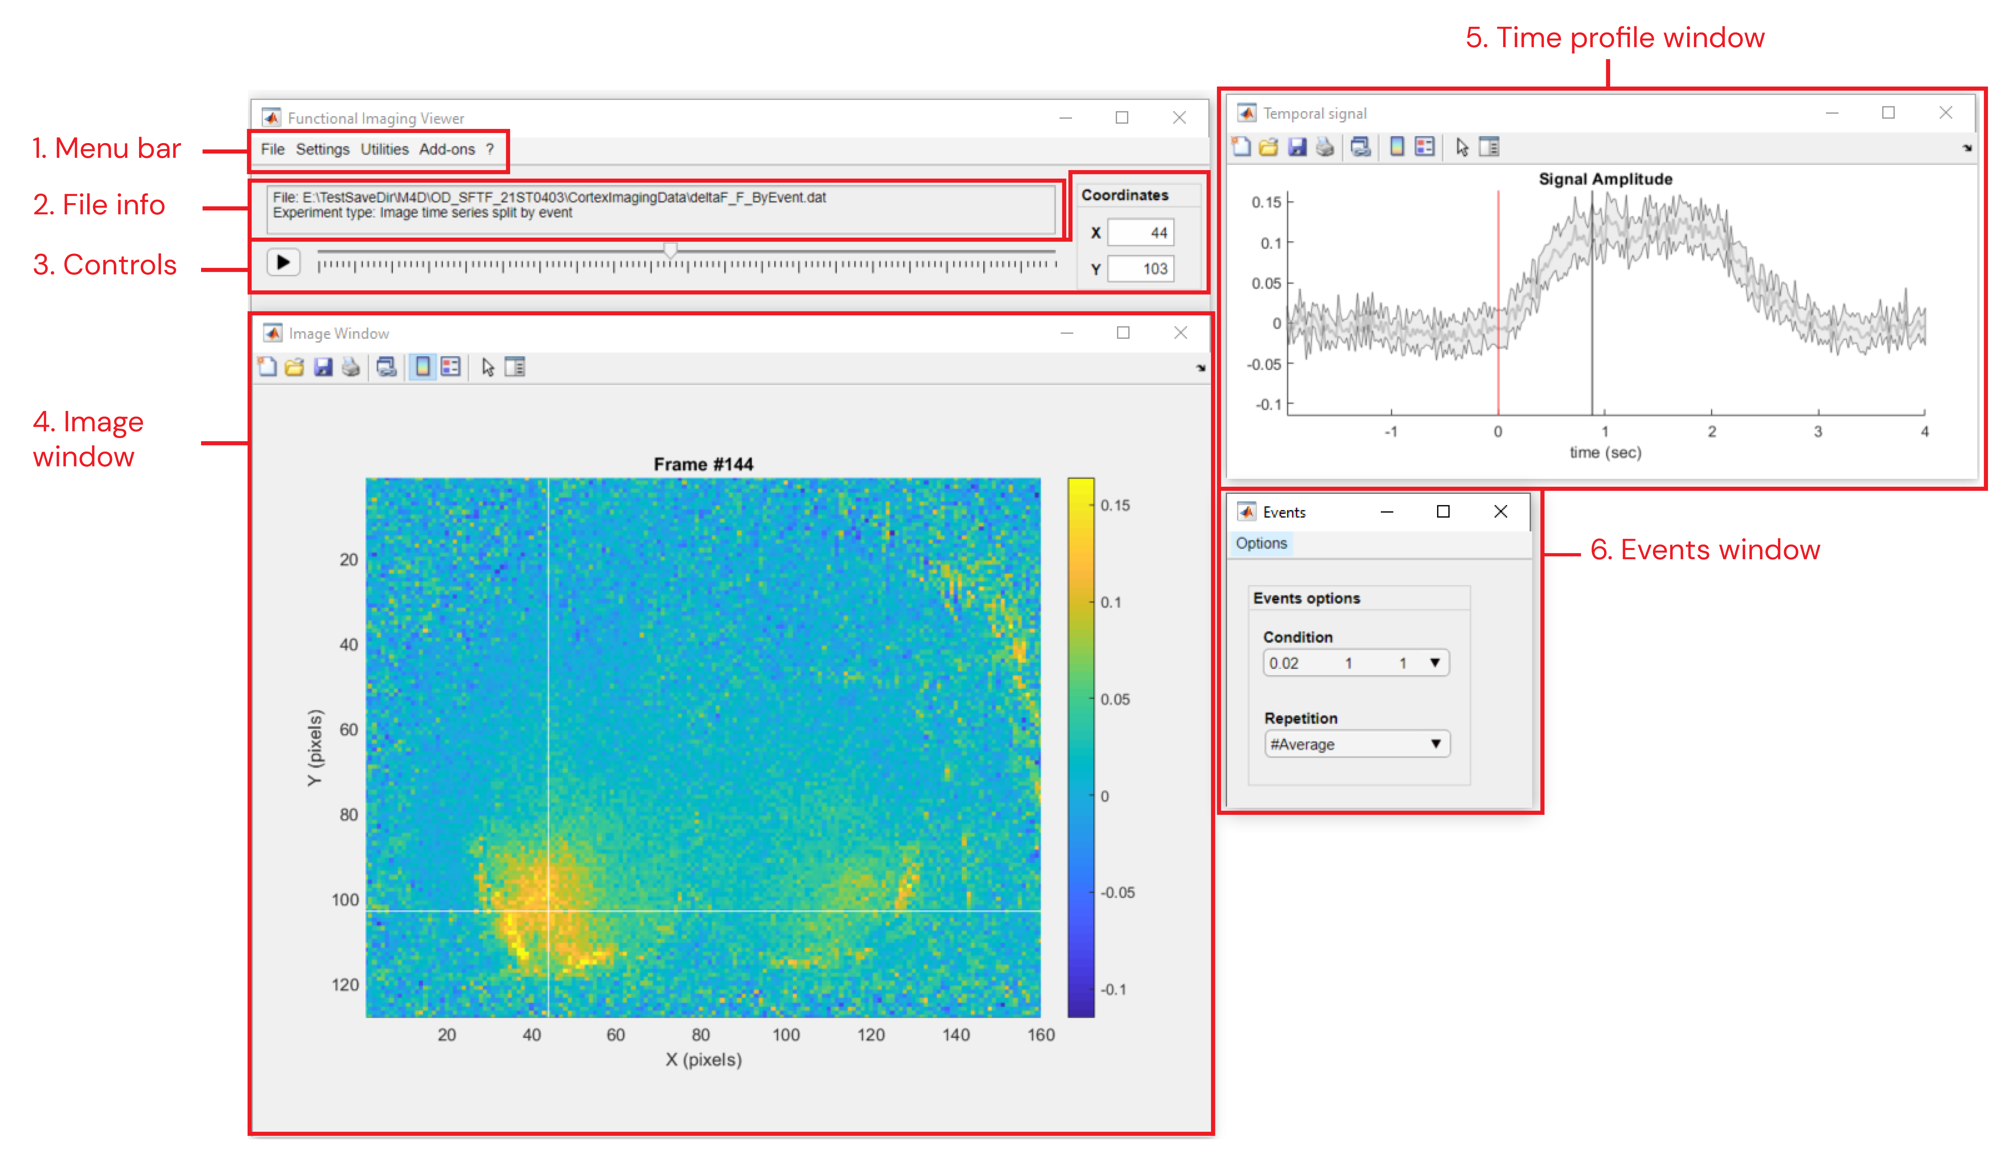
Main components of the DataViewer app
1. Menu Bar
- File >>
- Open: Opens dialog to load previously saved .DAT files
- Import Raw data >>
- from LabeoTech system: Import raw data from LabeoTech Imaging Systems. Read the documentation of run_ImagesClassification function for details
- from TIFF: Import raw data from .TIFF files. Read the documentation of importFromTif function for details
- Export... >>
- images: Opens dialog to export Image and temporal signal windows (PNG (default), JPEG, PDF or EPS formats)
- movie: Opens dialog to export Image and temporal signal windows as a movie (.AVI (default) or .MP4)
- data to .TIF: Exports the current data to a .TIF file with name img_<NAME>.tif. Works with 3D and 4D (image time series separated by events) datasets. As for the latter, one .TIF file will be created for each trial.
- Save as...: Open dialog to save current data into a .DAT file
- Batch processing: Batch process multiple folders >>
- Convert to TIFF: Converts raw files (.bin) and/or .dat files from LabeoTech systems to .TIFF format
- Run script: Executes a matlab script (.m) in each folder
- Gen. script: Creates a matlab script (.m) from a DataViewer's pipeline that can be used in the Run script utility
- Settings >>
- Image Options: Opens dialog to set image colormap and clipping values
- Playback speed: Sets movie speed for playback button (3. Controls). If the selected speed is too high, the app will reduce it to avoid lag
- Utilities >>
- Data processing: (Standalone only) Tool to setup image processing pipeline on the data using the analysis functions from the toolbox
- View Data History: Opens a table showing information about the analysis functions run for the opened data file
- Show trigger traces: Overlays the High states of triggers listed in the events.mat file located in the same folder as the displayed dataset (currently available only for image time series)
- Manage events: Launches the Event Management tool to handle event triggers originating from LabeoTech system's analog inputs and use it to separate the data by different conditions.
- View ROI data (Standalone only) >>
- ROI traces: Tool to visualize ROI values as a function of time or events. Read the documentation of the Line Box-plot tool for details
- Correlation matrix: Tool to visualize a correlation matrix from displayed ROIs. Read the documentation of the Correlation Matrix plot tool for details
- OiS Dual Cam Coregistration: Tool used for OiS Dual Camera systems (LabeoTech) to assess coregistration quality and manage the coregistration parameters
- ROImanager: Launches the ROImanager app as add-on
- Multi-plots: Launches the Multi-plot tool
- Enable FFT View: Allows the visualisation of image time series data in the frequency domain
2. File info
Displays the current file path and the experiment type.
3. Controls
The main window has some control options for image time series:
- Slider: interactive selection of frames
- Play button: plays a movie
- Coordinates: Sets the X,Y coordinates of the crosshair in the Image window
4. Image window
Click on the image to select a pixel. For image time series, the signal amplitude of the selected pixel will be updated in the temporal profile figure.
Use the figure's Data Tips button(![]() ) to add data tips with information about the selected pixel.
) to add data tips with information about the selected pixel.
5. Time profile window
This window will be visible only for data containing Time dimension. Double-click over the plotted line to shift the current frame to the point in time.
As for the Image Window, use the figure's Data Tips button to add data tips showing the signal amplitude and time delay values.
6. Events window
This window will be visible only for data containing Events. Use this window to change the currently displayed condition/repetition or to edit the events list.
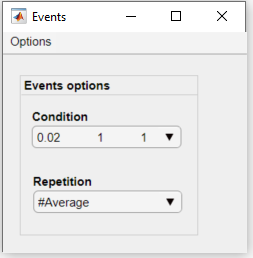
Events window
- Events Options panel
- Condition: select the condition to be displayed
- Repetition: select the repetition or the #Average of the current condition
- Options menu
- Delete current... : Deletes the current condition or repetition from the file's .mat meta data file.
- Condition: deletes the current condition
- Repetition: deletes the current repetition
- Restore all: restores the condition and repetition to the original lists.
- Delete current... : Deletes the current condition or repetition from the file's .mat meta data file.