Introduction to DataViewer
DataViewer is an app dedicated to exploring mesoscale imaging data. The app allows one to perform basic data exploration by moving through frames and events. One can also inspect the temporal profile of individual pixels or regions of interest (ROIs).
Start MATLAB with umIT on the path. To open data immediately, have a supported .dat or image-kind .umt file available.
Open the app
- Run DataViewer; in MATLAB, or run DataViewer("path/to/file.dat"); to open a file immediately.
- If no file was supplied, choose File > Open.
- Check the status line and the recording context shown above the image.
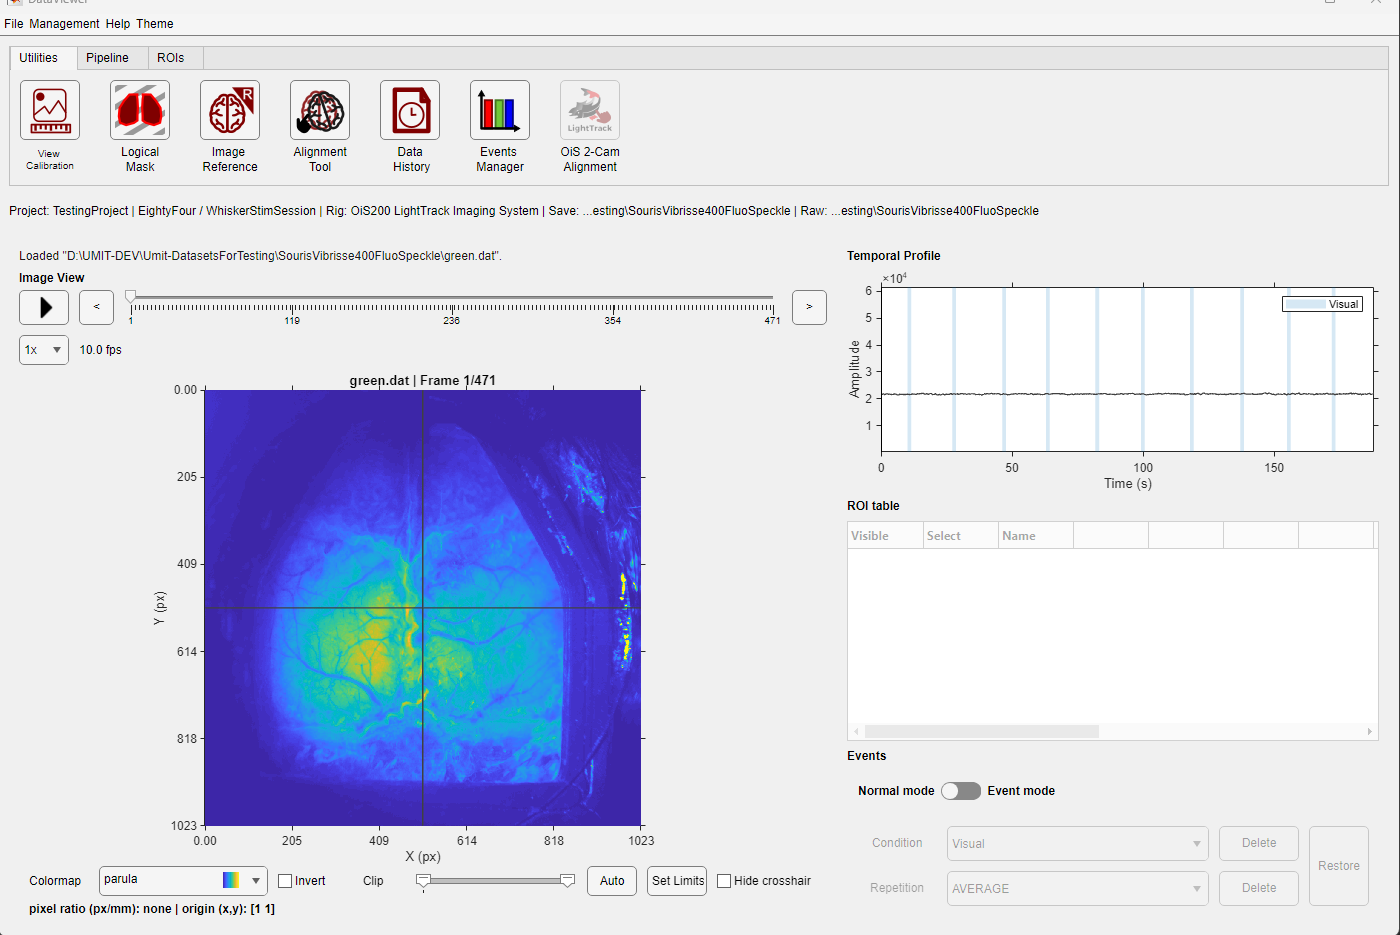
Current DataViewer: application tabs, image, temporal profile, ROI table, and event controls.
What you are looking at
| Area | Purpose |
|---|---|
| Utilities, Pipeline, ROIs | Open related tools, configure processing, and create or manage ROIs. |
| Image View | Shows the selected frame. Clicking a pixel moves the crosshair and updates the temporal profile. |
| Temporal Profile | Shows the selected pixel or visible ROI signals over time. |
| ROI table | Controls ROI selection, visibility, names, colors, and measurements. |
| Events | Switches between continuous and event-aligned views when valid event metadata exists. |
What is saved?
Opening and viewing data does not change the imaging file. Display choices stay in memory unless a specific save or export command says otherwise.