Generating event-triggered maps
Here, we show how to create an analysis pipeline to generate event-triggered activation maps of calcium signals from whiskers stimulation in a mouse. In this example you will learn:
- How to preprocess calcium imaging data.
- How to split the data using events.
- How to create response amplitude maps.
Important
In this particular example, the events (i.e. triggers) are generated by the LabeoTech's imaging system. The data import function automatically detects and creates an events.mat file to be used by the toolbox.
There are several ways of creating events associated with an imaging recording session. To date, support for triggers generated by LabeoTech's imaging systems is provided and built-in the analysis function run_ImagesClassification.m. However, the toolbox provides auxiliary functions to support the creation of custom functions to import events from other sources. For more information, click here.
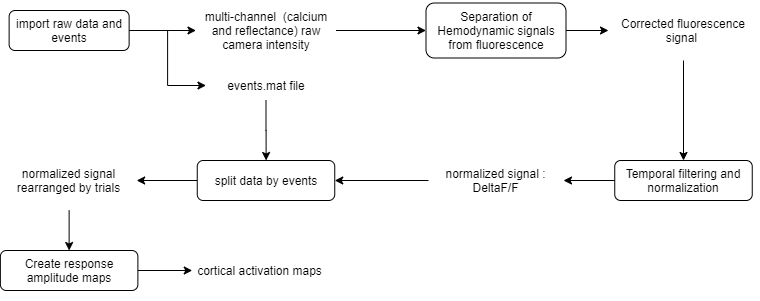
The raw data consists of multi-channel (fluorescence and reflectance) recordings of an anesthetized mouse expressing GCaMP6 calcium indicator in cortical neurons. Here is the analysis workflow:
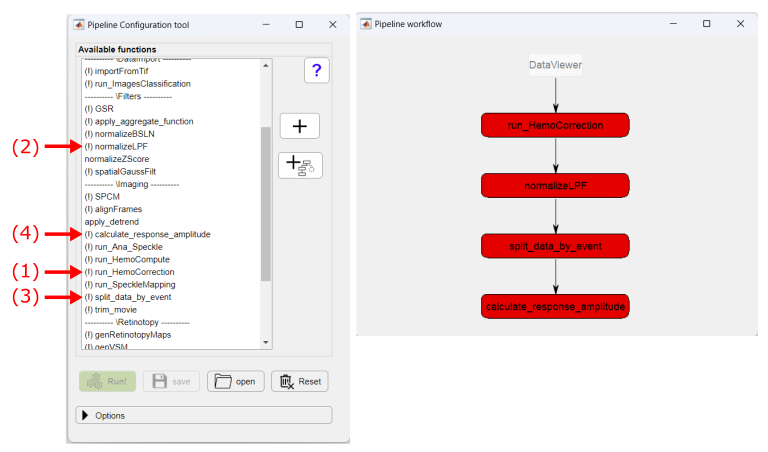
Pipeline workflow of event-triggered maps
Sections
- Import the data: Import the data to be processed.
- Create and run the analysis pipeline: build the analysis pipeline to be applied to the selected data.
Import the data to be processed
Note
In this example, we show how to process the data of a single experiment using the DataViewer app. However, the same pipeline can be created and run using the main GUI(umIToolbox). The only difference here is that the data import function run_ImagesClassification is called directly from the main menu in File>>Import Raw data. Check the tutorial on how to create functional connectivity maps to learn how to run analysis pipelines using the main GUI.
To open the standalone version of DataViewer app, in Matlab's command window type:
DataViewer
In the main menu, go to File >> Import Raw data >> from LabeoTech System. Next, select the folder containing the raw files (img_xxxx.bin) and the folder to save the imported .dat files.
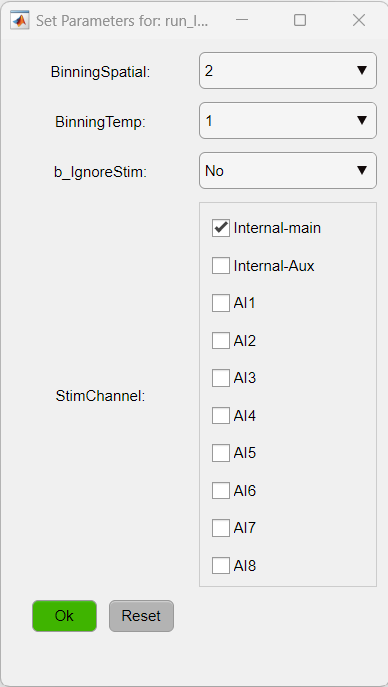
Now, set optional parameters for the data import function run_ImagesClassification. For details on the parameters, read the function's documentation.
Here, we will apply a spatial binning of 2 and select the Internal-main channel containing the events. Click "Ok" to import the data.
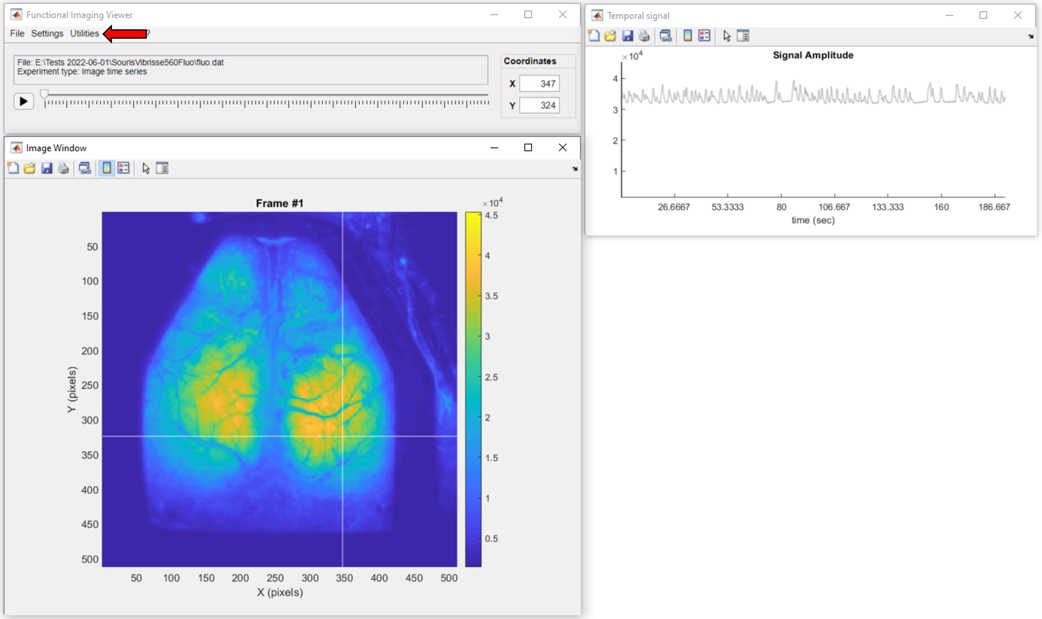
When the data import function execution is concluded, open the fluorescence output file fluo.dat:
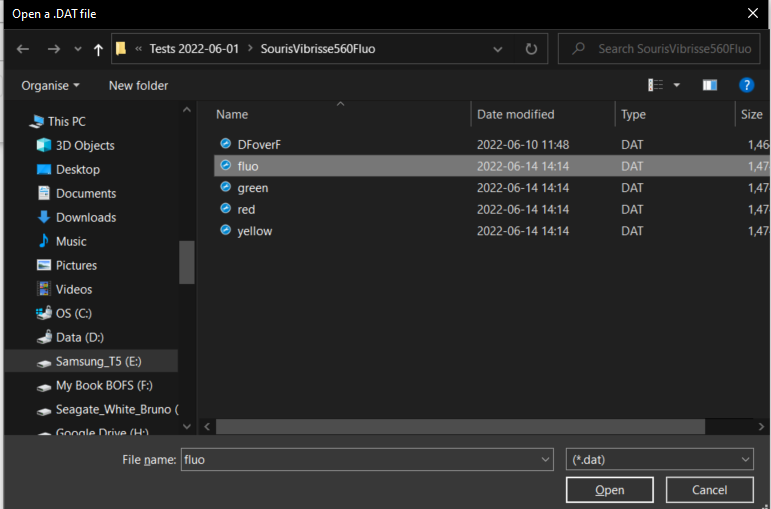 .
. Create and run the analysis pipeline
When the fluo.dat file is loaded, in the main menu, go to Utilities >> Data Processing to launch the Pipeline Configuration app:
In the Pipeline Configuration app, select the functions to create the remaining steps of the pipeline to obtain the cortical activation maps:
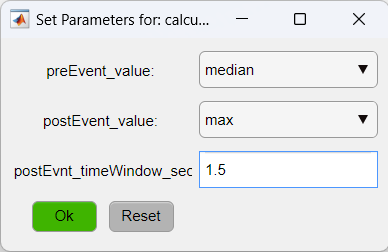
We will set the optional parameters of the function calculate_response_amplitude to calculate amplitude as the maximum value of the signal in the first 1.5 seconds post-event minus the median of the pre-event time:
Finally, click on Run! to execute the pipeline.
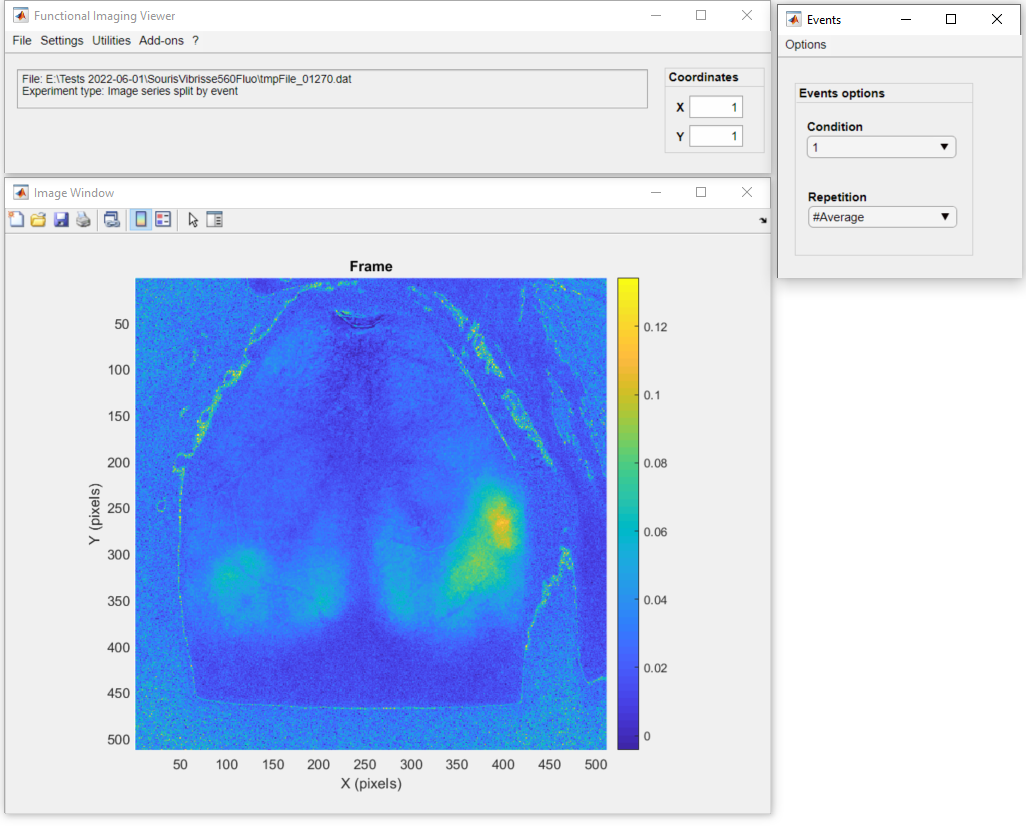
Here is the final result of the pipeline showing the average cortical activation map with the increased signal amplitude in the right barrel cortex:
Click, here to learn more on how to explore the data split by events using DataViewer!